|
Mechatronics
Documentation for ME 405 labs
|


|
|
Mechatronics
Documentation for ME 405 labs
|
|
Lab 0xFF: Term Project
This is the culminating lab for ME 405, integrating controller results from homeworks, communication protocols from previous labs, and integration on the ME 405 project board. The goal of the term project is to balance a ball in the center of a moving platform. This is accomplished with two motors (one for each angular degree of freedom), encoders and a touch panel sensor to get ball and panel locations and velocities. While unimplemented in the term project, in theory the encoder data could be replaced with readings from the IMU without a change in response. This lab was completed in several stages, each with their own detailed documentation and testing procedures.
This lab is organized into main code, plots, drivers, and tests. The main code consists of:
Drivers (in the /drivers module) are responsible for interacting with physical hardware and are described in more detail in the Lab Progress section below.
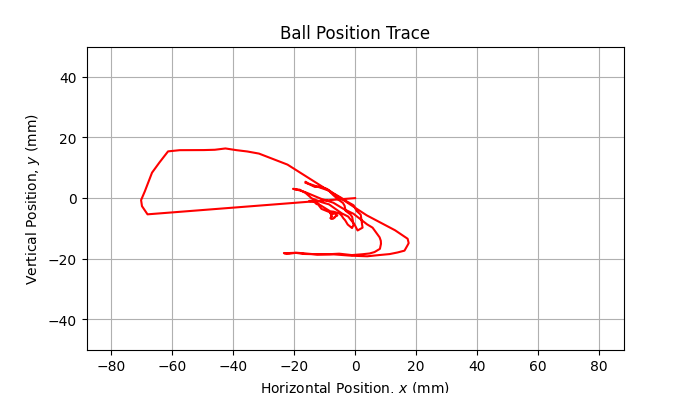
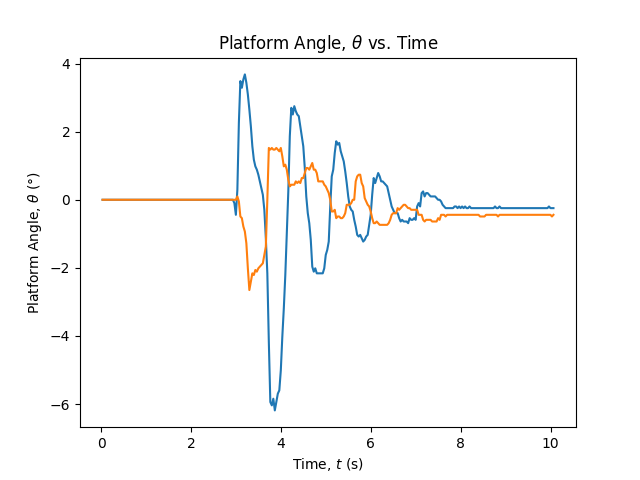
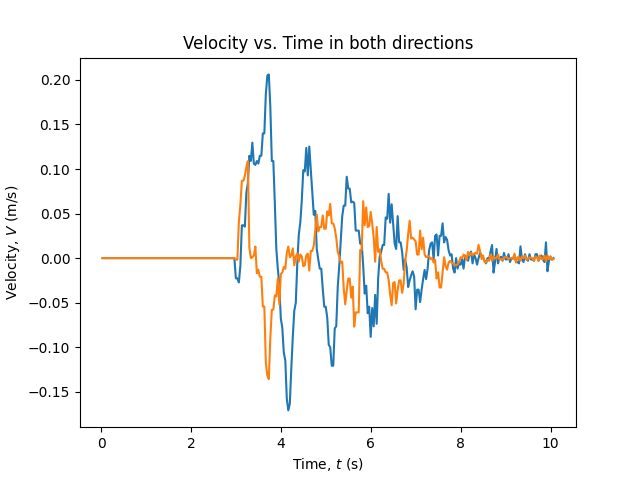
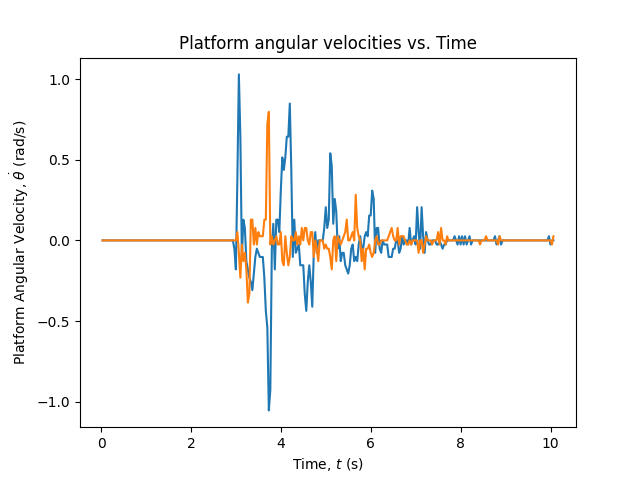
All acquired data is saved in the /plots directory in a folder corresponding to the time of data collection. The following plots are generated each run (see Chapter 5: Balancing the Ball for examples):
Finally the /test directory contains files used for testing and calculating timing.
The first task for this lab was determining the coordinate position of the ball by reading from a touch panel. More details on testing, calibration, and driver capabilities in TouchPanel.py.
The second task is to drive each motor independently using the Texas Instruments DRV8847 motor driver. Most of the code from this section was copied from the driver developed for ME 305, with added functionality related to overcurrent protection. See Motor.py for additional details.
The third task required is developing a driver to interface with the encoders attached to each motor. All of the functional code for this driver was copied from ME 305 with some minor changes in the documentation. See Encoder.py for additional details.
Due to time constraints I elected to not use the IMU. While it may have provided more accurate measurements of the platform angle, the system has fair stability reading from the encoders. One major benefit of using the IMU that I was unable to account for is having to level the platform each time before running the controller. I was forced to implement a calibration phase where the user levels the platform manually to start before placing the ball on it.
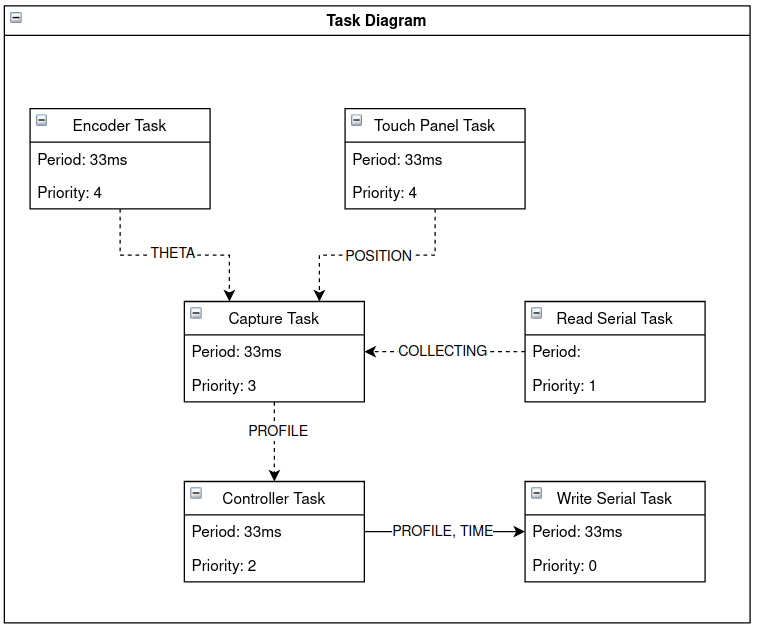
The bulk of the work on this lab was in integrating the sensors and performing UI operations. Although some sample code was provided to aid in task scheduling, I decided to implement my own scheduling scheme for code readability and significant performance gains. After some task analysis, I determined that there are only really two separate tasks that need to be run in parallel: 1) Updating the State and controller then sending data, and 2) Recieving user inputs. Because the first task can be run sufficiently quickly (at 30Hz) velocity measurements and encoder readings stay updated. Additionally, because it is much faster to read both Touch Panel positions at once, both axies have the same time for each reading, weakening any gains from parallelization. Therefore, while velocity calculation and controller updates could be performed asynchronously, they are performed at the same time. Doing so not only has the added benefit of code simplicity, but also helps to reduce parasitic delay. For the first task a linear logic model is then adopted: 1) Capture the state by reading Touch Panel positons, Encoder positions, then calculating velocities for both axies. 2) Update each axis' controller with the newly captured state 3) Write a data point to the serial line consisting of:
Below is a task diagram to illustrate this program flow:
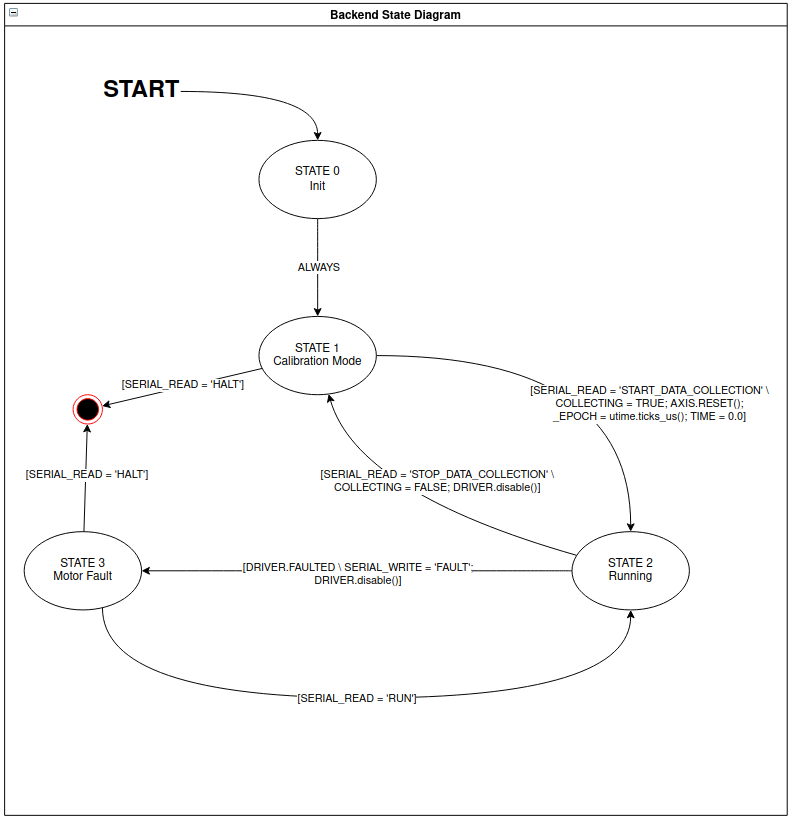
Below is a state diagram for the backend. For more information see main.py .
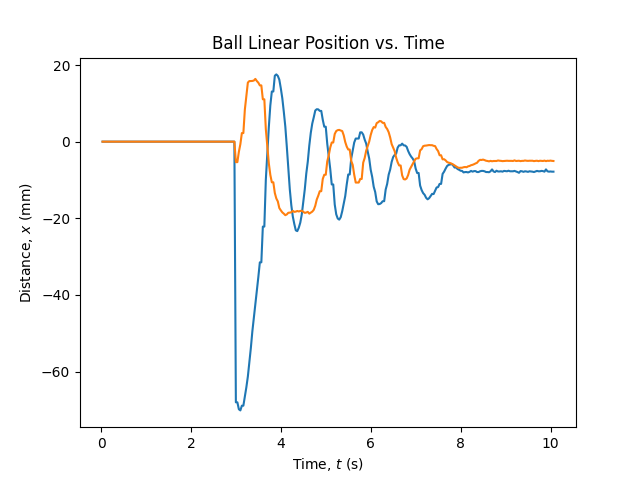
This scheme also helps to simplify data collection. Below are plots generated from a test run of the system. Data collected for this run can be referenced in response.json.
| 
|
| 
|
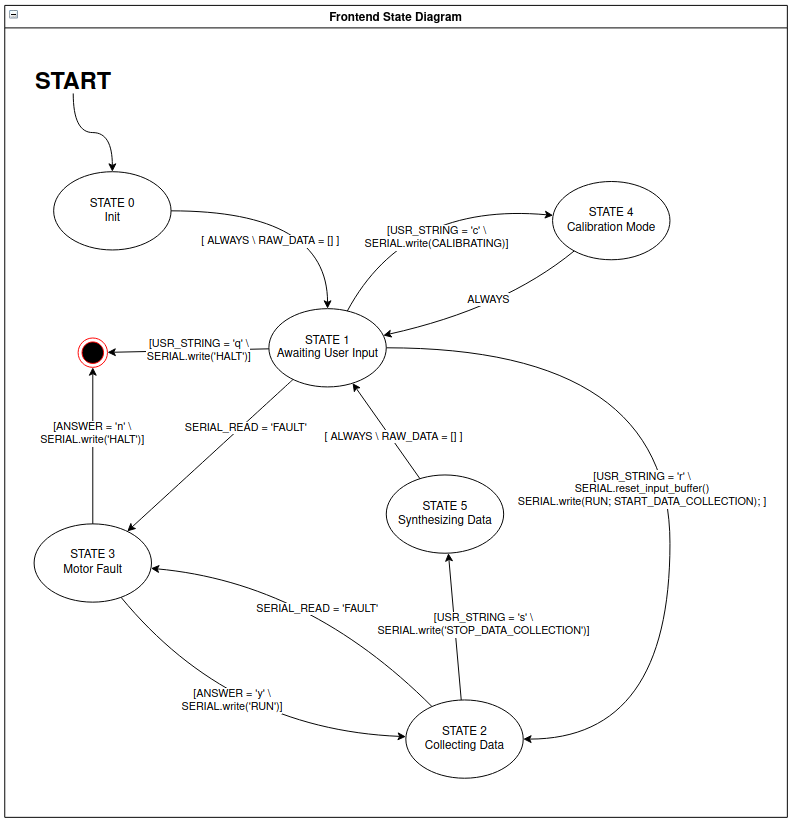
Click Here for an example video illustrating the frontend flow and data collection routine. Below is a state diagram illustrating the control flow for the frontend.
 1.8.17